Outlier detection is a very broad topic, and boxplot is a part of that. Here is how to create a boxplot in R and extract outliers. There are few things to consider when creating a boxplot in R or anywhere else. Is boxplot showing all the necessary information? Sometimes it is important how many data points you have. Maybe you have to build a boxplot by subcategories?
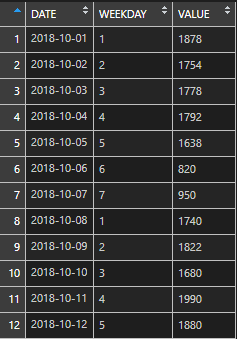
Here is my data. If you want to know more about how to build an R data frame from scratch, check this out.
DATA <- data.frame(
  DATE  = c("2018-10-01", "2018-10-02", "2018-10-03", "2018-10-04", "2018-10-05", "2018-10-06", "2018-10-07", "2018-10-08", "2018-10-09", "2018-10-10", "2018-10-11", "2018-10-12", "2018-10-13", "2018-10-14", "2018-10-15", "2018-10-16", "2018-10-17", "2018-10-18", "2018-10-19", "2018-10-20", "2018-10-21", "2018-10-22", "2018-10-23", "2018-10-24", "2018-10-25", "2018-10-26", "2018-10-27", "2018-10-28", "2018-10-29", "2018-10-30", "2018-10-31", "2018-11-01", "2018-11-02", "2018-11-03", "2018-11-04"),
  WEEKDAY = as.numeric(c("1", "2", "3", "4", "5", "6", "7", "1", "2", "3", "4", "5", "6", "7", "1", "2", "3", "4", "5", "6", "7", "1", "2", "3", "4", "5", "6", "7", "1", "2", "3", "4", "5", "6", "7")),
  VALUE = as.numeric(c("1878", "1754", "1778", "1792", "1638", "820", "950", "1740", "1822", "1680", "1990", "1880", "1504", "808", "1822", "1746", "3748", "2098", "1720", "906", "832", "2092", "2198", "2074", "1892", "1824", "1048", "938", "1790", "2006", "4010", "1808", "1866", "1106", "874"))
)
As you can see in the preview, there might be big enough differences between weekdays or working days and weekends. It is important to investigate outliers also in those categories. To learn more about the method by which outliers are detected with boxplot, go here.
In addition to this data frame, I divided the days into two categories – working day and weekend.
DATA$DAYTYPE <- ifelse(DATA$WEEKDAY >5, "WEEKEND", "WORKING DAY")
Boxplot by subcategories
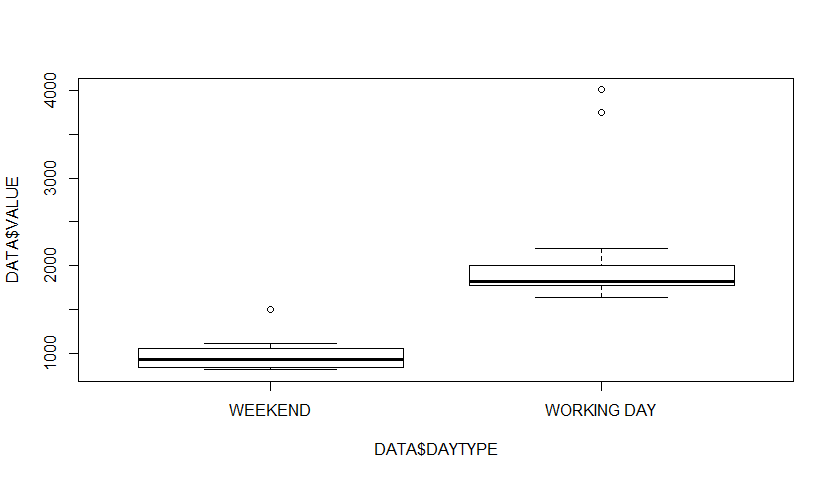
It is easily done with a base function boxplot.
boxplot(DATA$VALUE ~ DATA$DAYTYPE)

With boxplot()$out you can take a look at the outliers by each subcategory.
boxplot(DATA$VALUE ~ DATA$DAYTYPE)$out
How to extract R data frame rows with boxplot outliers
To get all rows from the data frame that contains boxplot detected outliers, you can use a subset function.
subset(DATA, DATA$VALUE %in% boxplot(DATA$VALUE ~ DATA$DAYTYPE)$out)

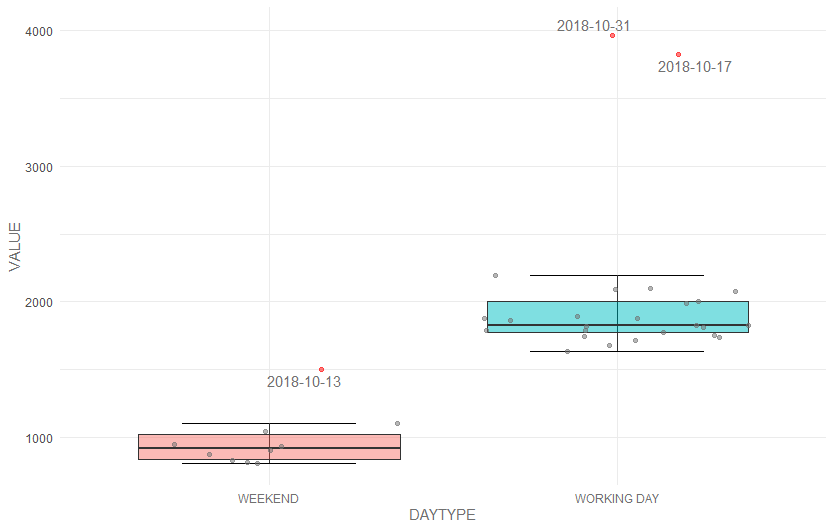
To successfully visualize boxplot with all data points and highlight outliers in another color, I made some additional columns to my data frame – OUTLIER and INLIER. As you can see, I added plot argument to boxplot function, because otherwise the plot is made by default.
The initial code looks like this.
DATA <- data.frame(
  DATE  = c("2018-10-01", "2018-10-02", "2018-10-03", "2018-10-04", "2018-10-05", "2018-10-06", "2018-10-07", "2018-10-08", "2018-10-09", "2018-10-10", "2018-10-11", "2018-10-12", "2018-10-13", "2018-10-14", "2018-10-15", "2018-10-16", "2018-10-17", "2018-10-18", "2018-10-19", "2018-10-20", "2018-10-21", "2018-10-22", "2018-10-23", "2018-10-24", "2018-10-25", "2018-10-26", "2018-10-27", "2018-10-28", "2018-10-29", "2018-10-30", "2018-10-31", "2018-11-01", "2018-11-02", "2018-11-03", "2018-11-04"),
  WEEKDAY = as.numeric(c("1", "2", "3", "4", "5", "6", "7", "1", "2", "3", "4", "5", "6", "7", "1", "2", "3", "4", "5", "6", "7", "1", "2", "3", "4", "5", "6", "7", "1", "2", "3", "4", "5", "6", "7")),
  VALUE = as.numeric(c("1878", "1754", "1778", "1792", "1638", "820", "950", "1740", "1822", "1680", "1990", "1880", "1504", "808", "1822", "1746", "3748", "2098", "1720", "906", "832", "2092", "2198", "2074", "1892", "1824", "1048", "938", "1790", "2006", "4010", "1808", "1866", "1106", "874"))
)

DATA$DAYTYPE <- ifelse(DATA$WEEKDAY >5, "WEEKEND", "WORKING DAY")

# base boxplot and outliers
boxplot(DATA$VALUE ~ DATA$DAYTYPE)
boxplot(DATA$VALUE ~ DATA$DAYTYPE)$out
subset(DATA, DATA$VALUE %in% boxplot(DATA$VALUE ~ DATA$DAYTYPE)$out)

# columns for visualization
DATA$OUTLIER <- ifelse(DATA$VALUE %in% boxplot(DATA$VALUE ~ DATA$DAYTYPE, plot = F)$out, DATA$VALUE, NA)
DATA$INLIER <- ifelse(is.na(DATA$OUTLIER), DATA$VALUE, NA)
R boxplot with data points and outliers in a different color
Here is ggplot2 based code to do that.
I also used package ggrepel and function geom_text_repel to deal with data labels. It helps to position them in a way that is easy to read.
Ggplot2 geom_jitter parameter position and function position_jitter was very important to synchronize how data points and data labels will position themselves with each other.
By using stat_boxplot, I added additional error bars to ggplot boxplot to better see upper and lower limits.
require(ggplot2)
require(ggrepel)
require(dplyr)

DATA %>%
  ggplot(aes(x = DAYTYPE, y = VALUE, label = DATE)) +
  theme_minimal()+
  theme(axis.text.x = element_text(colour = "gray44"), axis.title = element_text(colour = "gray44"))+ # change color of the axis labels and titles
  stat_boxplot(geom = "errorbar", width = 0.5) + # add proper whiskers on boxplot
  geom_boxplot(aes(fill = DAYTYPE), alpha = 0.5, outlier.shape = NA, show.legend = F) +
  geom_jitter(aes(x = DAYTYPE, y = INLIER), color = "gray44", na.rm = T, size = 1.8, stroke = 0, alpha = 0.5)+ # add inlier points with jitter
  geom_jitter(aes(x = DAYTYPE, y = OUTLIER), color = "red", na.rm = T, size = 1.8, stroke = 0, alpha = 0.5, position = position_jitter(seed = 1))+ # add outlier points in different color
  geom_text_repel(aes(x = DAYTYPE, y = OUTLIER), size = 4, position = position_jitter(seed = 1), na.rm = T, color = "gray44") # add data point labels without overlapping
Here are other great examples and my inspiration – boxplot with jitter.
Here is the full code used in this post.
DATA <- data.frame(
  DATE  = c("2018-10-01", "2018-10-02", "2018-10-03", "2018-10-04", "2018-10-05", "2018-10-06", "2018-10-07", "2018-10-08", "2018-10-09", "2018-10-10", "2018-10-11", "2018-10-12", "2018-10-13", "2018-10-14", "2018-10-15", "2018-10-16", "2018-10-17", "2018-10-18", "2018-10-19", "2018-10-20", "2018-10-21", "2018-10-22", "2018-10-23", "2018-10-24", "2018-10-25", "2018-10-26", "2018-10-27", "2018-10-28", "2018-10-29", "2018-10-30", "2018-10-31", "2018-11-01", "2018-11-02", "2018-11-03", "2018-11-04"),
  WEEKDAY = as.numeric(c("1", "2", "3", "4", "5", "6", "7", "1", "2", "3", "4", "5", "6", "7", "1", "2", "3", "4", "5", "6", "7", "1", "2", "3", "4", "5", "6", "7", "1", "2", "3", "4", "5", "6", "7")),
  VALUE = as.numeric(c("1878", "1754", "1778", "1792", "1638", "820", "950", "1740", "1822", "1680", "1990", "1880", "1504", "808", "1822", "1746", "3748", "2098", "1720", "906", "832", "2092", "2198", "2074", "1892", "1824", "1048", "938", "1790", "2006", "4010", "1808", "1866", "1106", "874"))
)

DATA$DAYTYPE <- ifelse(DATA$WEEKDAY >5, "WEEKEND", "WORKING DAY")

# base boxplot and outliers

boxplot(DATA$VALUE ~ DATA$DAYTYPE)
boxplot(DATA$VALUE ~ DATA$DAYTYPE)$out
subset(DATA, DATA$VALUE %in% boxplot(DATA$VALUE ~ DATA$DAYTYPE)$out)

# columns for visualization

DATA$OUTLIER <- ifelse(DATA$VALUE %in% boxplot(DATA$VALUE ~ DATA$DAYTYPE, plot = F)$out, DATA$VALUE, NA)
DATA$INLIER <- ifelse(is.na(DATA$OUTLIER), DATA$VALUE, NA)


# final boxplot

require(ggplot2)
require(ggrepel)
require(dplyr)

DATA %>%
  ggplot(aes(x = DAYTYPE, y = VALUE, label = DATE)) +
  theme_minimal()+
  theme(axis.text.x = element_text(colour = "gray44"), axis.title = element_text(colour = "gray44"))+ # change color of the axis labels and titles
  stat_boxplot(geom = "errorbar", width = 0.5) + # add proper whiskers on boxplot
  geom_boxplot(aes(fill = DAYTYPE), alpha = 0.5, outlier.shape = NA, show.legend = F) +
  geom_jitter(aes(x = DAYTYPE, y = INLIER), color = "gray44", na.rm = T, size = 1.8, stroke = 0, alpha = 0.5)+ # add inlier points with jitter
  geom_jitter(aes(x = DAYTYPE, y = OUTLIER), color = "red", na.rm = T, size = 1.8, stroke = 0, alpha = 0.5, position = position_jitter(seed = 1))+ # add outlier points in different color
  geom_text_repel(aes(x = DAYTYPE, y = OUTLIER), size = 4, position = position_jitter(seed = 1), na.rm = T, color = "gray44") # add data point labels without overlapping

Leave a Reply