By creating a hex color code sequence in R, you can use that for the color gradient in visualizations. There are multiple ways how to achieve that.
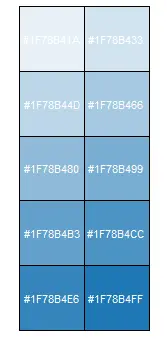
Here is an example that inspired me from word cloud visualization with the quanteda package. After creating a number sequence, it is possible to use that in the adjustcolor function.
col <- sapply(seq(0.1, 1, 0.1), function(x) adjustcolor("#1F78B4", x))

col

#[1] "#1F78B41A" "#1F78B433" "#1F78B44D" "#1F78B466" "#1F78B480" "#1F78B499" "#1F78B4B3"
#[8] "#1F78B4CC" "#1F78B4E6" "#1F78B4FF"
Here is how to display the result where the colors are defined as strings in R. You can create a table with hex color codes and use the appropriate color in the background. One of the easiest ways how to preview colors with hex color codes or without them in R is with the show_col function from the scales package.
scales::show_col(col, cex_label = 0.7, ncol = 2)

Another way to create a hex color code sequence in R is with the function colorRampPalette. This function lets you create another function that returns the number of necessary colors.
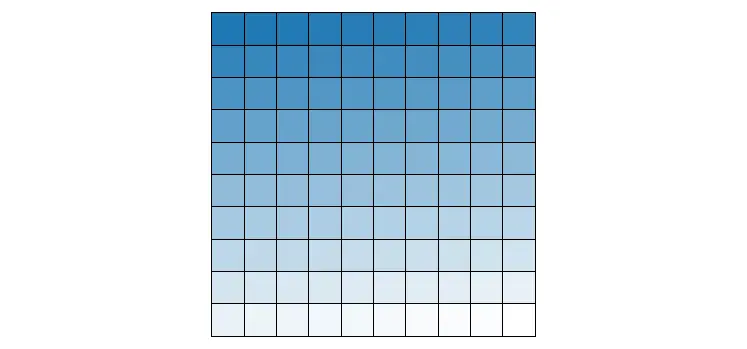
For example, here is a hex color sequence from previously used color code to white color. Firstly I will define the necessary range.
getHEXcolors <- colorRampPalette(c("#1F78B4", "#FFFFFF"))Secondly, I will return 100 colors between those two.
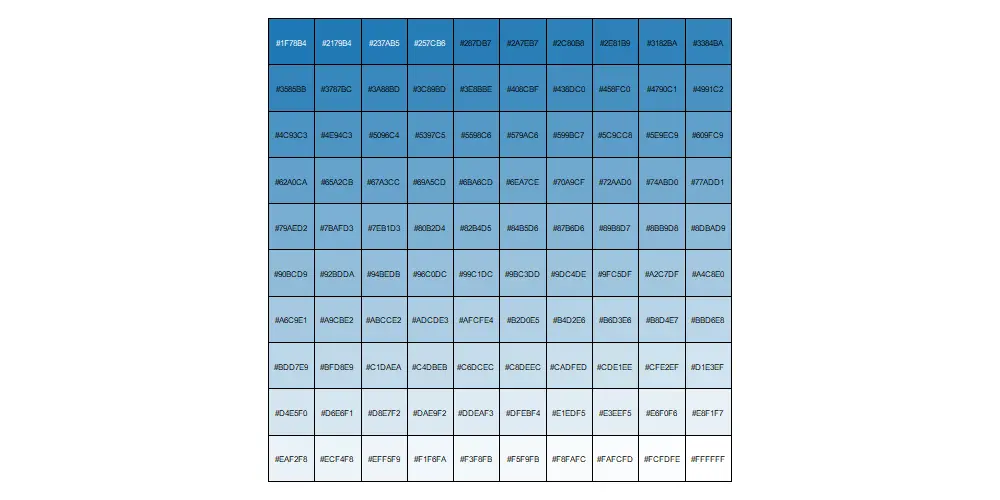
scales::show_col(getHEXcolors(100), labels = FALSE)

You can display the result as previously with the function show_col, but there is another option. It is worth mentioning the seecolor package. For example, there is a function print_color that can print some of the colors in the RStudio console.
seecolor::print_color(getHEXcolors(100))

You can use the colorRampPalette function to get variations between more than two hex color codes, and instead of hex codes, use color names.
getHEXcolors <- colorRampPalette(c("lightskyblue","white","lightskyblue"))
Leave a Reply