A moving average can help to see data insights that sometimes are a little bit hidden behind seasonality. Here is how to calculate a moving average or sum in Power BI by using DAX. Sometimes moving average is called running or rolling average, but it is all the same.
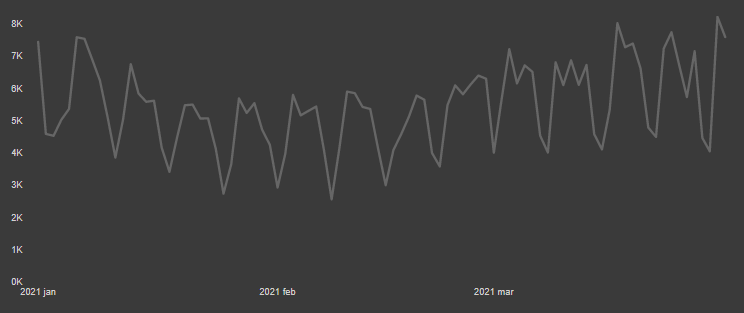
Here is my data. It contains weekly seasonality. In that case, a 7-day moving average should work very well to smooth that out. That is a typical seasonality that may appear in daily data. By using monthly data you should consider 12 periods in a season.
Keep in mind that not all of the report users might be familiar with this kind of measure. Try to add some explanations if you are not using moving average in combination with actual values.
Calculate moving average in Power BI only starting from the first full period
That is an important addition to calculation. If your moving average represents 7 days, then it should contain equal periods of the time series.
_7d moving average =
VAR period = 7
VAR the_first_date =
    CALCULATE ( FIRSTDATE ( MyTable[Date] ), ALLSELECTED ( MyTable[Date] ) )
VAR last_date =
    LASTDATE ( MyTable[Date] )
VAR sum_in_period =
    CALCULATE (
        SUM ( MyTable[Value] ),
        DATESINPERIOD ( MyTable[Date], last_date, - period, DAY )
    )
RETURN
    IF ( last_date - the_first_date >= period - 1, sum_in_period / period )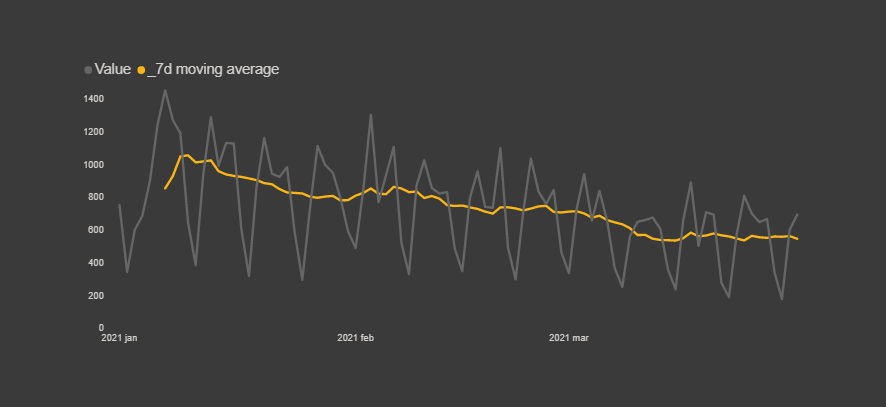
Calculate moving sum in Power BI
Calculation of 7 days moving sum it a little bit easier and in some cases may show the same trend and dynamic as moving average.
_7d moving sum =
VAR period = 7
VAR the_first_date =
    CALCULATE ( FIRSTDATE ( MyTable[Date] ), ALLSELECTED ( MyTable[Date] ) )
VAR last_date =
    LASTDATE ( MyTable[Date] )
VAR sum_in_period =
    CALCULATE (
        SUM ( MyTable[Value] ),
        DATESINPERIOD ( MyTable[Date], last_date, - period, DAY )
    )
RETURN
    IF ( last_date - the_first_date >= period - 1, sum_in_period )
Additional information
If some of the series has missing date values, you should better rely on the table in your data model that contains all necessary dates. For example, if in some of the cases there is no data every Sunday. Ideally, a date table, but you can create a calculated table that contains a list of dates.
Here you can download the pbix file that contains the result.
If this was helpful for you, then take a look at 4 ways how to organize DAX measures.
If there is a situation when you have a lot of them, good measure management will save you time.
Please take a look at other Power BI posts in this blog.
Leave a Reply