If you are new to R, one of the first questions might be how to add a column to the R data frame. Here are multiple scenarios that will help you to handle this task.
By using the $ sign in R, you can manipulate data frame content. You can take a look at something that I already there, overwrite or create new one.
I will use airquality data set to demonstrate that.
head(airquality)

#  Ozone Solar.R Wind Temp Month Day
#1    41     190  7.4   67     5   1
#2    36     118  8.0   72     5   2
#3    12     149 12.6   74     5   3
#4    18     313 11.5   62     5   4
#5    NA      NA 14.3   56     5   5
#6    28      NA 14.9   66     5   6
There is one column that contains temperatures in the Fahrenheit range.
head(airquality$Temp)

#[1] 67 72 74 62 56 66
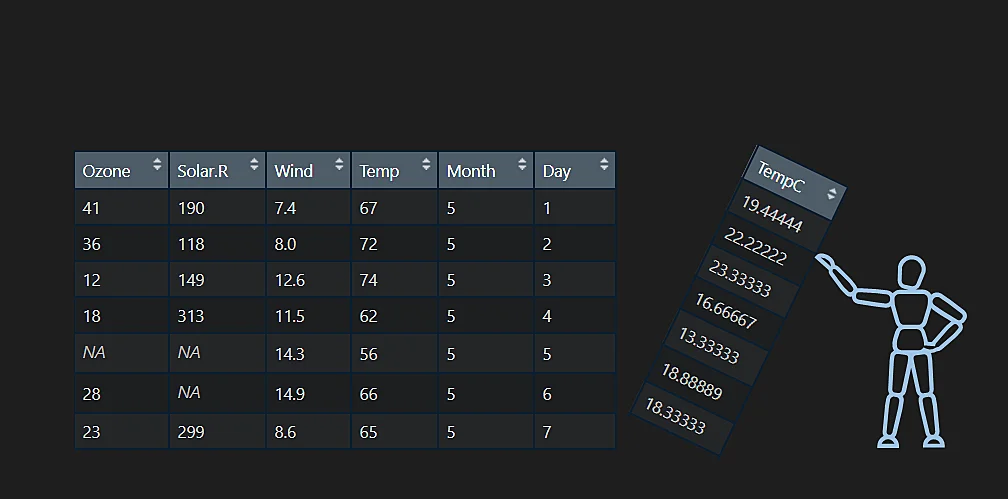
I will convert these Fahrenheit temperatures into Celsius by using these instructions. Here is how to add a new column to the R data frame by using the $ sign.
airquality$TempC <- 5 / 9 * (airquality$Temp - 32)

head(airquality)

#  Ozone Solar.R Wind Temp Month Day    TempC
#1    41     190  7.4   67     5   1 19.44444
#2    36     118  8.0   72     5   2 22.22222
#3    12     149 12.6   74     5   3 23.33333
#4    18     313 11.5   62     5   4 16.66667
#5    NA      NA 14.3   56     5   5 13.33333
#6    28      NA 14.9   66     5   6 18.88889
Add a column with mutate function from dplyr
Dplyr is one of the most popular packages in R, and it contains the function mutate that is useful in this scenario. The previously created column with the conversion from Fahrenheit to Celsius will look like this.
require(dplyr)

airquality <- airquality %>% mutate("TempC" = 5 / 9 * (Temp - 32))

head(airquality)

#  Ozone Solar.R Wind Temp Month Day    TempC
#1    41     190  7.4   67     5   1 19.44444
#2    36     118  8.0   72     5   2 22.22222
#3    12     149 12.6   74     5   3 23.33333
#4    18     313 11.5   62     5   4 16.66667
#5    NA      NA 14.3   56     5   5 13.33333
#6    28      NA 14.9   66     5   6 18.88889
There are two useful arguments before and after that you can use in the function mutate to add and move the column to the necessary position at the same time.
require(dplyr)

airquality %>%
  mutate("TempC" = 5 / 9 * (Temp - 32), .before = Month) %>%
  head()

#  Ozone Solar.R Wind Temp    TempC Month Day
#1    41     190  7.4   67 19.44444     5   1
#2    36     118  8.0   72 22.22222     5   2
#3    12     149 12.6   74 23.33333     5   3
#4    18     313 11.5   62 16.66667     5   4
#5    NA      NA 14.3   56 13.33333     5   5
#6    28      NA 14.9   66 18.88889     5   6
Dplyr is a very useful package in R, and these 10 tips might help you quickly elevate your skills.
Add multiple columns to the R data frame
With help of the function mutate from dplyr, you can easily add multiple columns to the R data frame.
Let’s say that I want to create a column that contains converted temperature from Fahrenheit to Celsius and another with a rounded result. Rounding might look like a simple task, but I highly recommend taking a deeper look at some of the specific situations in R with rounding.
airquality <- airquality %>% mutate(
  "TempC" = 5 / 9 * (Temp - 32),
  "RoundedTempC" = round(TempC, digits = 0)
)

head(airquality)

#  Ozone Solar.R Wind Temp Month Day    TempC RoundedTempC
#1    41     190  7.4   67     5   1 19.44444           19
#2    36     118  8.0   72     5   2 22.22222           22
#3    12     149 12.6   74     5   3 23.33333           23
#4    18     313 11.5   62     5   4 16.66667           17
#5    NA      NA 14.3   56     5   5 13.33333           13
#6    28      NA 14.9   66     5   6 18.88889           19
If you add only two columns, you can use a basic approach like at the beginning of this post.
Add an empty column in R
Here is how to create an empty data frame column.
airquality$EmptyCol <- NA

head(airquality)

#  Ozone Solar.R Wind Temp Month Day    TempC RoundedTempC EmptyCol
#1    41     190  7.4   67     5   1 19.44444           19       NA
#2    36     118  8.0   72     5   2 22.22222           22       NA
#3    12     149 12.6   74     5   3 23.33333           23       NA
#4    18     313 11.5   62     5   4 16.66667           17       NA
#5    NA      NA 14.3   56     5   5 13.33333           13       NA
#6    28      NA 14.9   66     5   6 18.88889           19       NA
The alternative to that is the add_column function from tibble, which would fit better in the dplyr workflow. This function has additional arguments that help you move a new column to a certain position. It is possible to move columns anyway, but with additional steps.
airquality <- airquality %>% tibble::add_column("EmptyCol2" = NA)

head(airquality)

#  Ozone Solar.R Wind Temp Month Day    TempC RoundedTempC EmptyCol EmptyCol2
#1    41     190  7.4   67     5   1 19.44444           19       NA        NA
#2    36     118  8.0   72     5   2 22.22222           22       NA        NA
#3    12     149 12.6   74     5   3 23.33333           23       NA        NA
#4    18     313 11.5   62     5   4 16.66667           17       NA        NA
#5    NA      NA 14.3   56     5   5 13.33333           13       NA        NA
#6    28      NA 14.9   66     5   6 18.88889           19       NA        NA
Create an empty data frame in R
It might sound easy because it contains only empty columns. Here is a post from this blog that includes simple instructions on how to do that.
Create a new column in R with the condition
One of the best solutions for beginners is using the function ifelse which works similarly to the if function in Excel.
airquality$CondCol <- ifelse(airquality$Temp > 70, "high", "low")

head(airquality)

#  Ozone Solar.R Wind Temp Month Day    TempC RoundedTempC EmptyCol EmptyCol2 CondCol
#1    41     190  7.4   67     5   1 19.44444           19       NA        NA     low
#2    36     118  8.0   72     5   2 22.22222           22       NA        NA    high
#3    12     149 12.6   74     5   3 23.33333           23       NA        NA    high
#4    18     313 11.5   62     5   4 16.66667           17       NA        NA     low
#5    NA      NA 14.3   56     5   5 13.33333           13       NA        NA     low
#6    28      NA 14.9   66     5   6 18.88889           19       NA        NA     low
If you have a simple condition and true or false in the result is enough, you can create a conditional column simpler.
airquality$CondCol <- airquality$Temp > 70

head(airquality)

#  Ozone Solar.R Wind Temp Month Day    TempC RoundedTempC EmptyCol EmptyCol2 CondCol
#1    41     190  7.4   67     5   1 19.44444           19       NA        NA   FALSE
#2    36     118  8.0   72     5   2 22.22222           22       NA        NA    TRUE
#3    12     149 12.6   74     5   3 23.33333           23       NA        NA    TRUE
#4    18     313 11.5   62     5   4 16.66667           17       NA        NA   FALSE
#5    NA      NA 14.3   56     5   5 13.33333           13       NA        NA   FALSE
#6    28      NA 14.9   66     5   6 18.88889           19       NA        NA   FALSE
Here is how to convert them into 1 and 0.
Opposite of adding columns to the R data frame
If you want to do the opposite of adding something to the data frame, take a look at this post.
This post explains how to remove unnecessary columns in R in at least 4 different ways.
Here is how to split the existing data frame column in R.
Leave a Reply