Here is how to get data from the same week last year in Power BI using DAX measure. I recommend using ISO week and year numbering to get an equal number of days each week and distinguish each year. Sometimes, when you have an unequal number of weeks in years, it might not be easy, and I will show you how to deal with that.
The weekly dimension is not my favorite way how to group my data. On the other hand, if you have weekly seasonality, then it might look better in charts. You might be interested in looking at your data using grouping by ISO weeks or 7-day moving average.
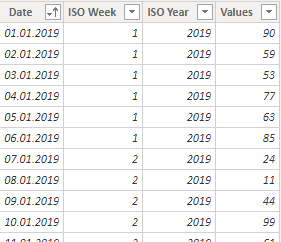
To demonstrate the technique, I will generate data in Power Query – dates for a couple of years, ISO week and year, and random numbers. You can recreate this data set by using this M code in a blank query. The code is below this post.
Get data from the same week last year in Power BI
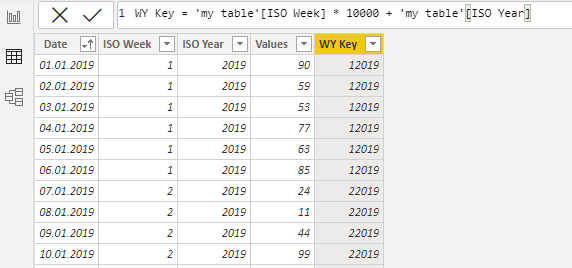
1. Create a column with week and year combinations that will help to calculate previous year numbers and calculate data from certain rows. It might not be useful for sorting data but in this situation is what you need.
WY Key = 'my table'[ISO Week] * 10000 + 'my table'[ISO Year]
2. Create a measure that will calculate data from the same week last year.
Weekly Data Previous YearX =
CALCULATE (
    SUM ( 'my table'[Values] ),
    FILTER (
        ALL ( 'my table' ),
        'my table'[WY Key]
            = MAX ( 'my table'[WY Key] ) - 1
    )
)
Weekly data comparison issue with week number 53
Let’s take a look at the results in the diagram. As you can see in the picture below, there is no previous year’s data for week 53. The year 2019 doesn’t have that.
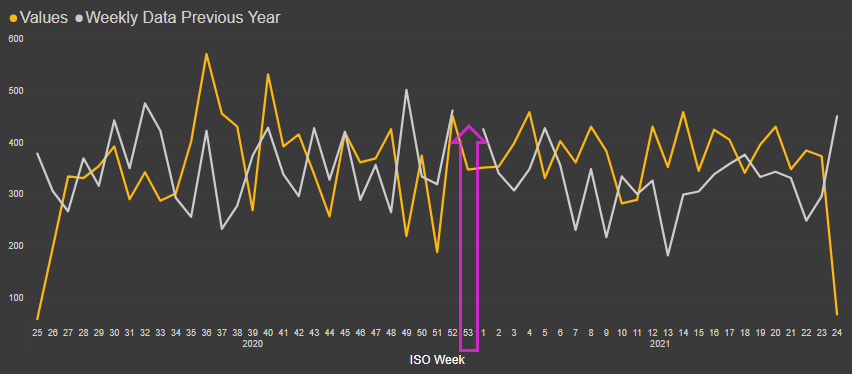
If it is alright for you, then you can leave it as it is. Or if you want to repeat results from week 52 and get the line uninterrupted, it could be done like this.
Weekly Data Previous Year =
VAR wdpy1 =
    CALCULATE (
        SUM ( 'my table'[Values] ),
        FILTER (
            ALL ( 'my table' ),
            'my table'[WY Key]
                = MAX ( 'my table'[WY Key] ) - 1
        )
    )
VAR wdpy2 =
    CALCULATE (
        SUM ( 'my table'[Values] ),
        FILTER (
            ALL ( 'my table' ),
            'my table'[WY Key]
                = MAX ( 'my table'[WY Key] ) - 1 - 10000
        )
    )
RETURN
    IF ( ISBLANK ( wdpy1 ), wdpy2, wdpy1 )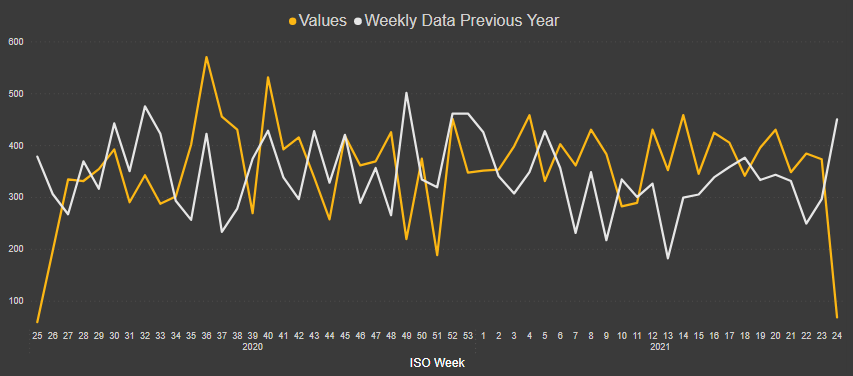
For the measures at this length, I recommend the DAX formatter.
Here are some useful tips on how to organize measures in Power BI.
Data sample M code.
let
    Source = List.Dates(#date(2019, 1, 1), 365 * 3, #duration(1, 0, 0, 0)),
    #"Converted to Table" = Table.FromList(Source, Splitter.SplitByNothing(), null, null, ExtraValues.Error),
    #"Renamed Columns" = Table.RenameColumns(#"Converted to Table",{{"Column1", "Date"}}),
    #"Changed Type" = Table.TransformColumnTypes(#"Renamed Columns",{{"Date", type date}}),
    #"Added ISO Week" = Table.AddColumn(#"Changed Type", "ISO Week", each if
Number.RoundDown((Date.DayOfYear([Date])-(Date.DayOfWeek([Date], Day.Monday)+1)+10)/7)=0

then
Number.RoundDown((Date.DayOfYear(#date(Date.Year([Date])-1,12,31))-(Date.DayOfWeek(#date(Date.Year([Date])-1,12,31), Day.Monday)+1)+10)/7)

else if
(Number.RoundDown((Date.DayOfYear([Date])-(Date.DayOfWeek([Date], Day.Monday)+1)+10)/7)=53
and (Date.DayOfWeek(#date(Date.Year([Date]),12,31), Day.Monday)+1<4))

then
1

else
Number.RoundDown((Date.DayOfYear([Date])-(Date.DayOfWeek([Date], Day.Monday)+1)+10)/7)),
    #"Changed Type1" = Table.TransformColumnTypes(#"Added ISO Week",{{"ISO Week", Int64.Type}}),
    #"Added ISO Year" = Table.AddColumn(#"Changed Type1", "ISO Year", each Date.Year(Date.AddDays([Date], 26 - [ISO Week]))),
    #"Changed Type2" = Table.TransformColumnTypes(#"Added ISO Year",{{"ISO Year", Int64.Type}}),
    #"Added random Values" = Table.AddColumn(#"Changed Type2", "Values", each List.Random(1)),
    #"Expanded Values" = Table.ExpandListColumn(#"Added random Values", "Values"),
    #"Multiplied Column" = Table.TransformColumns(#"Expanded Values", {{"Values", each _ * 100, type number}}),
    #"Rounded Off" = Table.TransformColumns(#"Multiplied Column",{{"Values", each Number.Round(_, 0), type number}})
in
    #"Rounded Off"
Leave a Reply