Here is how to detect the last available column value in Power BI in almost any situation. The main problem is columns with missing values in one or multiple places. But if your data contains something that represents a sequence, for example, date or index column, there is a simple solution.
There are multiple techniques to calculate the last value, and here is one of them, but they are not ideal if a column has missing values. That situation with missing values might be possible if your table has facts from different periods or data quality issues.
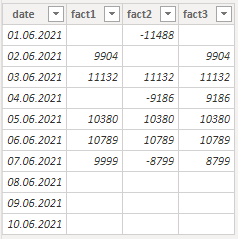
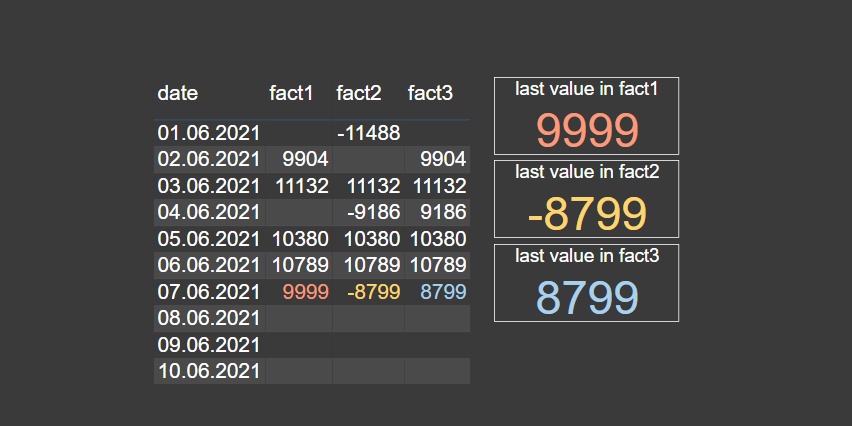
Here is my table called “simple_table”. The M code you can put in the blank Power Query is at the end of this post.
Last available column value in Power BI by using a measure
Step 1
You should have something that represents the sequence in your table. Most common are date or index columns that are in the table or created in DAX or Power Query. In my case, there is a date column.

Consider group index if there are multiple categories together. Here is a solution in Power Query and DAX.
Step 2
Create a measure that detects the last available value in the desired column.
I created a little mathematical trick where I multiplied date with the result of blank values detection. If the fact column row is blank the result is 0, otherwise, the result is 1. Look here for the explanation of how to convert TRUE and FALSE in Power BI to 1 and 0.
If I multiply something with 0, then the result is 0, otherwise the same value. The maximum of the results is the date for the last available fact. By using that, I can filter only that part of the table where is the last available value in a Power BI table column.
last_value_fact1 =
CALCULATE (
    MAX ( simple_table[fact1] ),
    FILTER (
        simple_table,
        simple_table[date]
            = MAXX (
                simple_table,
                INT ( NOT ISBLANK ( simple_table[fact1] ) ) * simple_table[date]
            )
    )
)
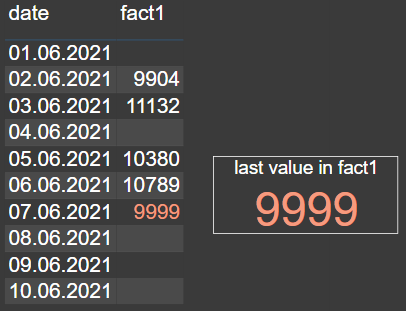
By putting this in the card visualization, you will see the result. It works for any of the fact columns.
Last available column value in Power BI by using a calculated column
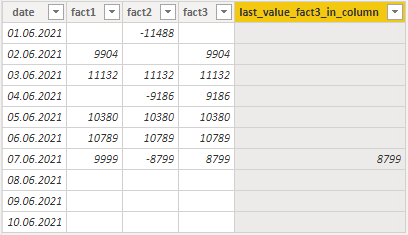
If you would like to get the last value in the calculated column, then here is how to do that for the third fact column.
last_value_fact3_in_column =
IF (
    simple_table[date]
        = MAXX (
            simple_table,
            INT ( NOT ISBLANK ( simple_table[fact3] ) ) * simple_table[date]
        ),
    simple_table[fact3]
)
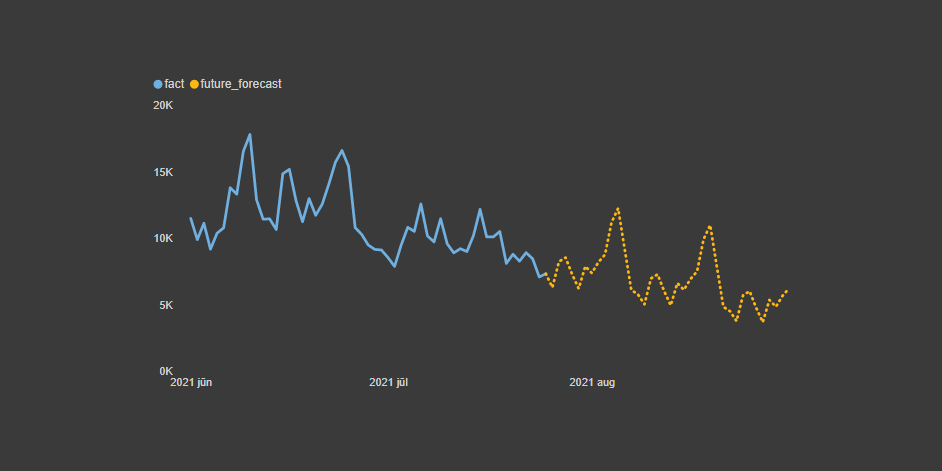
Here is how to apply this in a line chart visualization that looks like this.
M code for the table
Here is the M code for the table called “simple_table”.
let
    Source = Table.FromRows(Json.Document(Binary.Decompress(Binary.FromText("bY/RCcAgDER38buVnFpNZinuv0abKxStBeGF3COJ5xkEUWpMkhC2cL8dKKpe9+1O05CaSXkkVszzkAPIaSG18lli0OpzHBSOcY5klYXU6qQ1tYXU2nS1ebprIwlKOt/0ftn++5Cffr8A", BinaryEncoding.Base64), Compression.Deflate)), let _t = ((type nullable text) meta [Serialized.Text = true]) in type table [date = _t, fact1 = _t, fact2 = _t, fact3 = _t]),
    #"Changed Type" = Table.TransformColumnTypes(Source,{{"date", type date}, {"fact1", Int64.Type}, {"fact2", Int64.Type}, {"fact3", Int64.Type}})
in
    #"Changed Type"
Leave a Reply