Sometimes it is necessary to get the first and the last date of the week with DAX to create additional information in the tooltip, filter only full week periods, use weeks for continuous chart axis, etc.
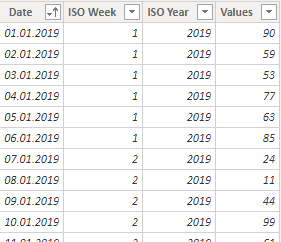
For demonstration purposes, I generated data set the same way as in the previous post. You can check that out and copy M code to the blank query to recreate these examples.

Calculate the first day of the week with DAX in Power BI
The main idea is to use the WEEKDAY function that gives different numbering for the same days of the week.
A measure of the first date of the current week
StartOfCurrentWeek =
TODAY () - WEEKDAY ( TODAY (), 3 )

First date of the week in the calculated column
If you want to get the first date of any week in your data, create a calculated column or measure.
FirstDateOfWeek =
'my table'[Date] - WEEKDAY ( 'my table'[Date], 3 )
A measure of the first date of the week
It depends on what is selected. In my case, I’m using year and week numbers to filter the necessary range of dates.
MinDateOfWeek =
VAR sv =
    CALCULATE (
        MIN ( 'my table'[Date] ),
        FILTER (
            'my table',
            'my table'[ISO Year] = SELECTEDVALUE ( 'my table'[ISO Year] )
                && 'my table'[ISO Week] = SELECTEDVALUE ( 'my table'[ISO Week] )
        )
    )
RETURN
    sv - WEEKDAY ( sv, 3 )
If you have only week numbering, then you can generate an additional table with dates that you can use in the data model.
Calculate the last day of the week with DAX in Power BI
It is easy if you know how to get the first date of the week. Just add 7 days.
A measure of the last date of the current week
EndOfCurrentWeek =
TODAY () - WEEKDAY ( TODAY (), 3 ) + 7
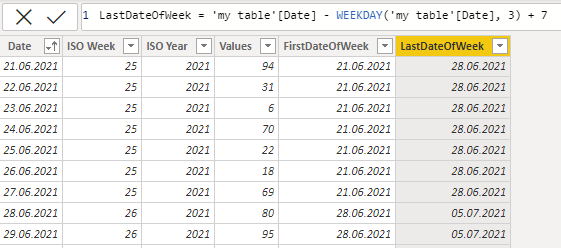
Last date of the week in the calculated column
LastDateOfWeek =
'my table'[Date] - WEEKDAY ( 'my table'[Date], 3 ) + 7
A measure of the last date of the week
MaxDateOfWeek =
VAR sv =
    CALCULATE (
        MAX ( 'my table'[Date] ),
        FILTER (
            'my table',
            'my table'[ISO Year] = SELECTEDVALUE ( 'my table'[ISO Year] )
                && 'my table'[ISO Week] = SELECTEDVALUE ( 'my table'[ISO Week] )
        )
    )
RETURN
    sv - WEEKDAY ( sv, 3 ) + 7
DAX measure with week date interval in the tooltip
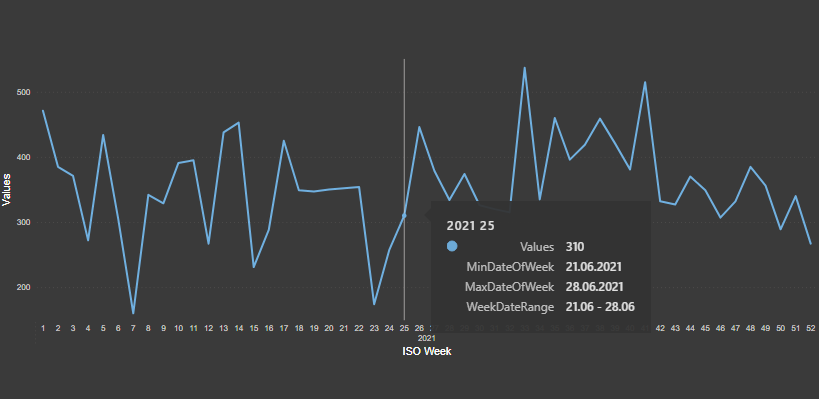
If you are using week numbering in visualization, it might be useful to see the corresponding period of dates in the tooltip. By combining two previously created measures, it is possible to show the range of the dates in the selected week.
WeekDateRange =
VAR sv =
    CALCULATE (
        MAX ( 'my table'[Date] ),
        FILTER (
            'my table',
            'my table'[ISO Year] = SELECTEDVALUE ( 'my table'[ISO Year] )
                && 'my table'[ISO Week] = SELECTEDVALUE ( 'my table'[ISO Week] )
        )
    )
VAR startdate =
    sv - WEEKDAY ( sv, 3 )
VAR enddate =
    sv - WEEKDAY ( sv, 3 ) + 7
RETURN
    FORMAT ( startdate, "dd.mm" ) & " - "
        & FORMAT ( enddate, "dd.mm" )
Use weeks in continuous Power BI chart axis
Sometimes it is necessary to use a continuous chart axis, and week numbers with years don’t work very well that way. The solution is to use the first date of the week instead.
Power BI filter for only full weeks
If you want to display data for only full weeks, it is easy to do if you know the starting date of a certain week. Create a calculated column that you can use to filter the necessary range.
FullWeekFilter =
VAR startofthisweek =
    TODAY () - WEEKDAY ( TODAY (), 3 )
VAR last25weeks = startofthisweek - 25 * 7
RETURN
    IF (
        'my table'[Date] >= last25weeks
            && 'my table'[Date] < startofthisweek,
        1,
        0
    )

Leave a Reply