Here is how to format output in the R console in 5 different ways to make your dataset look better if that’s necessary. In my case, I like to take a quick look at few lines of a data frame and want to add gridlines or other formatting features to make them easier to read.
1. Basic format for R console output
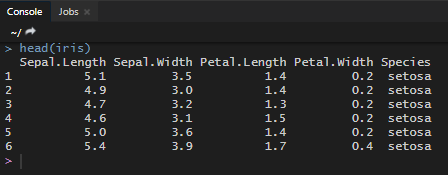
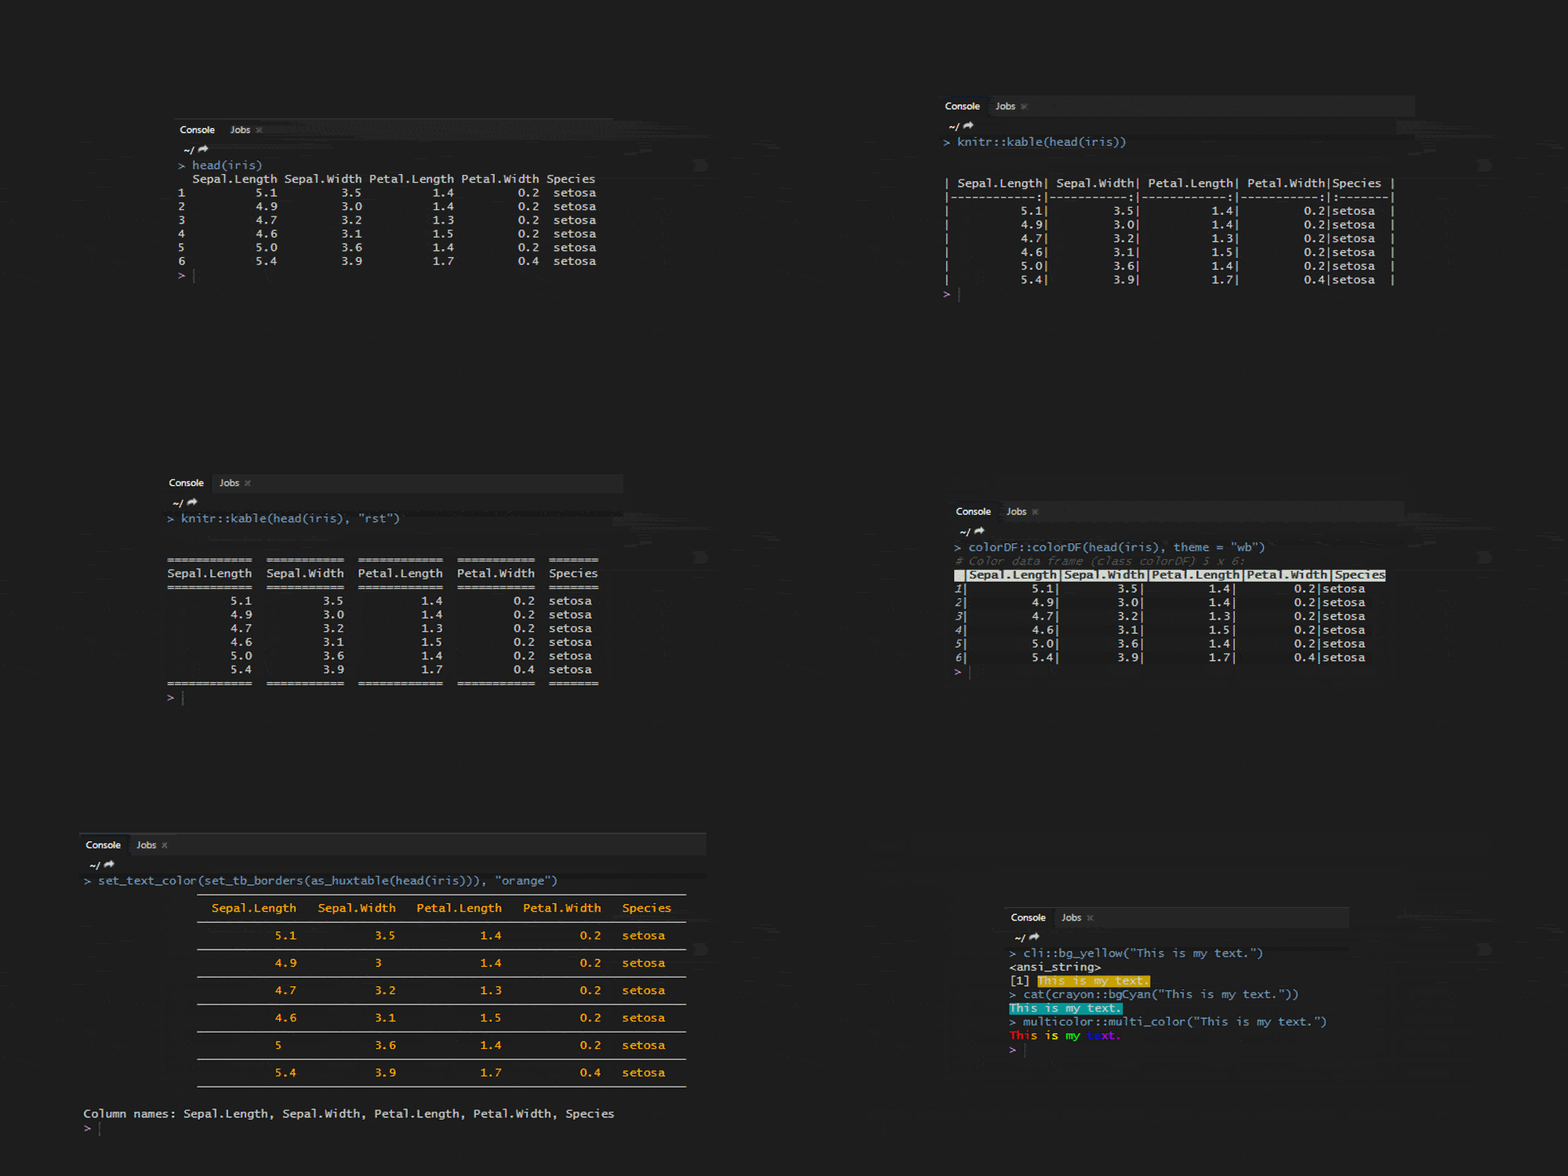
Here is the standard format for the first rows of the iris data frame in the R console. Useful most of the time and shows in colors that are defined by the RStudio theme.
head(iris)
2. Format for R console output with knitr
That is one of my favorites. Use the kable function from knitr if you want to see the output or your data frame in the R console with borders.
knitr::kable(head(iris))
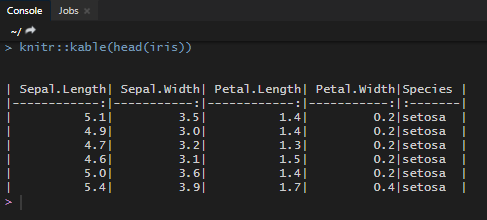
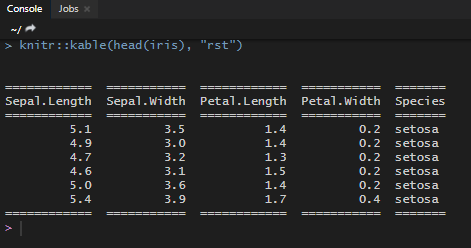
You can configure results that you can get kintr kable, and here is one of many examples. The border of the data frame sample looks different in the R console.
knitr::kable(head(iris), "rst")
If you want your console output results colorful, then the next two approaches can do that.
3. Format for R console output with ColorDF
ColorDF stands for colorful data frames in the R terminal, and you can get really beautiful results with that.
colorDF::colorDF(head(iris), theme = "wb")
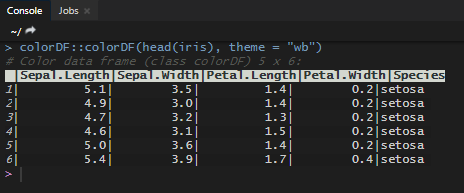
Not everything looks great in a specific theme, and it is easier to make a judgment with this function that shows all ColorDF available themes.
colorDF::colorDF_themes_show()
You can even use conditional formatting for your data frame content in the console view.
colorDF::highlight(head(iris), iris$Species == "setosa")
4. Format for R console output with huxtable
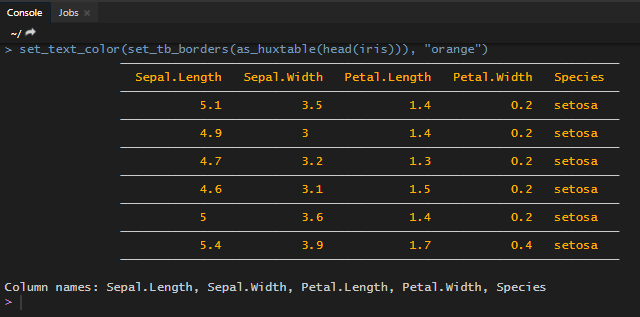
You can get similar results to the kable from the kintr package, but with the possibility to change the color of data frame content in the R console.
require(huxtable)

set_text_color(set_tb_borders(as_huxtable(head(iris))), "orange")
5. Change text color in R console
There are at least three packages that you can use to do that – crayon, multicolor, and cli. Here are examples of each of them.
cli::bg_yellow("This is my text.")

cat(crayon::bgCyan("This is my text."))

multicolor::multi_color("This is my text.")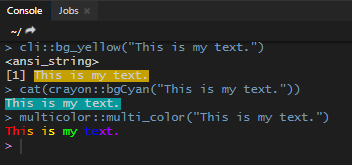
Additional tips
Create your own frequently usable solution
If you want to create your formatting for frequent use, then you can customize your R profile. Here is an example of how to do that and add your function to the namespace of existing packages.
Percentage format
Look at this post to know how to get percentage formatting for your decimal numbers and additional tips. It is important to get the percentage format in R without losing numerical properties.
Leave a Reply