Concatenate in R programming with functions paste and paste0
There are multiple ways how to concatenate values in R programming. Functions like paste and paste0 are used for that. It is good to know the difference between them.
in
Split (separate) data frame column into rows by using R
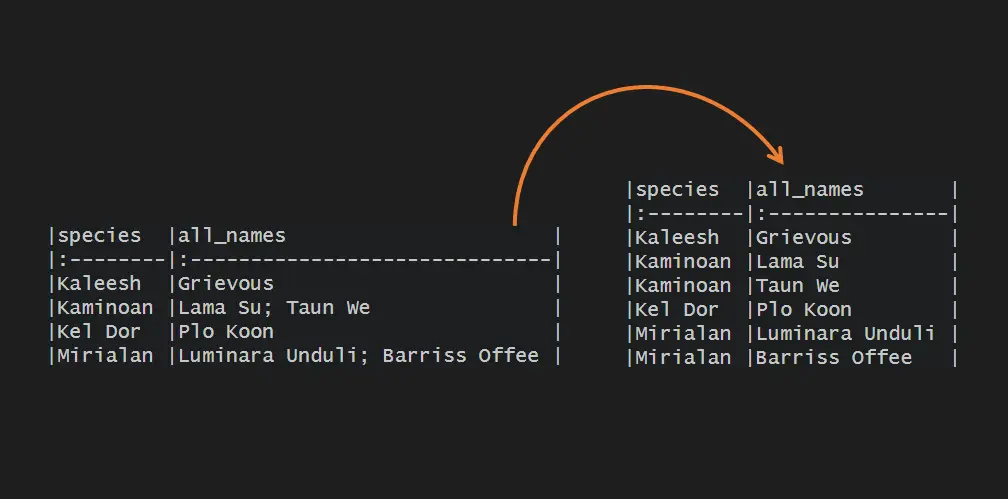
When you have a data frame with a column content grouped by a delimiter, you might want to split that into rows by using R. Not so frequent activity as splitting column into multiple columns by separator.
in

Replace Inf in R
Here is how to replace Inf in R if that is necessary for your data frame. It might appear in various situations, for example, when dividing with zero. In my example in this post, I have infinity when detecting min or max values in each data frame row.
in
Sort text as numbers in R
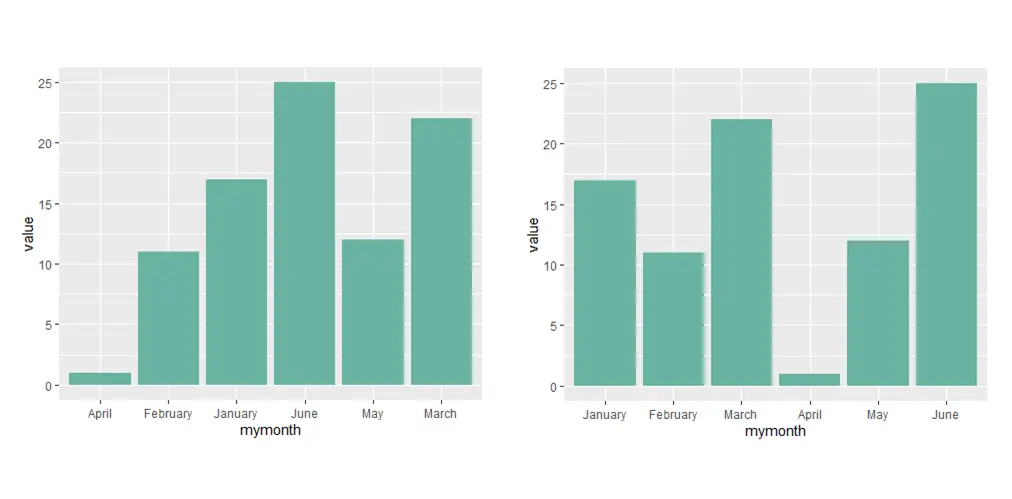
Sometimes it might be useful to sort text as numbers in R. For example, if you have a month’s names and it is necessary to show them in chronological order in ggplot. Even if the content is already in the right order, it doesn’t work that way on the x-axis.
in
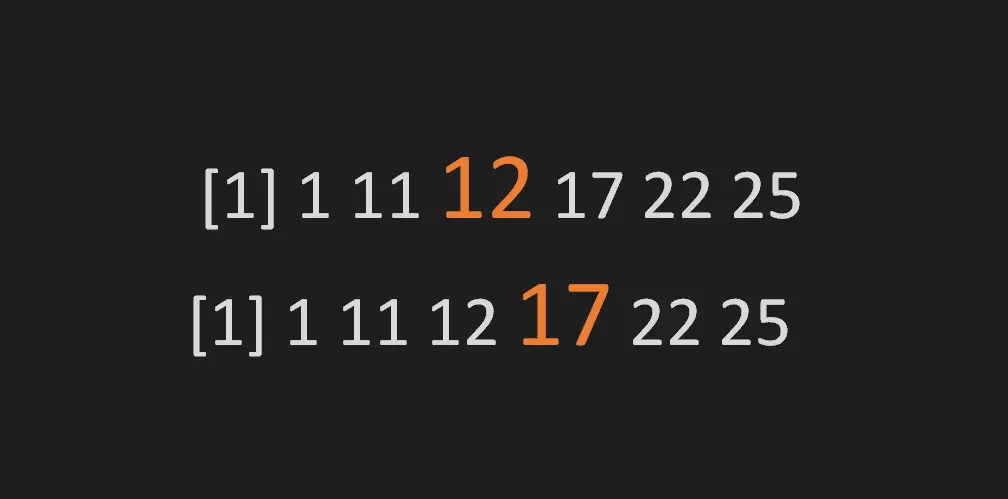
The exact number in the middle of the data series in R
Here is how to locate the number in the middle of the data series in R. If there is an odd number of values, you can easily calculate that with the median, but it is not the case if there is an even number of values. In the situation with an even number of values…
in
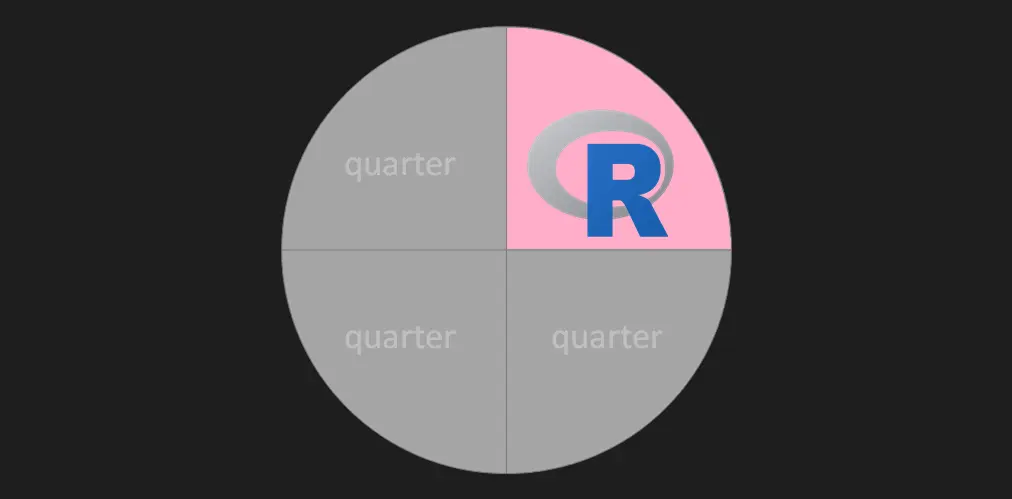
Extract quarter from date in R, create a year and quarter combination
Sometimes it is necessary to extract the quarter form date in R. You can use quarters to group values in a data frame or visualization. There are multiple options to achieve desired results, and you can choose what suits the best for you.
in
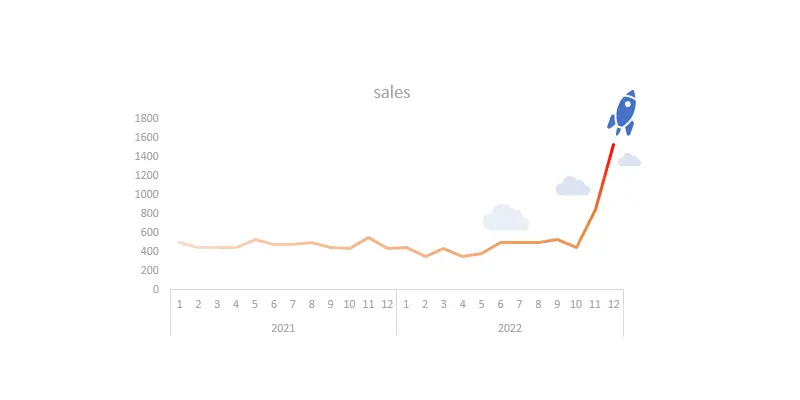
Line chart with gradient color in Excel
If you have a data set with certain characteristics, you might want to take a chance and create a line chart with gradient color in Excel. Sometimes by coincidence, you can tell a better story. For example, if something is suddenly changing over time. Otherwise, color gradients are a rarely used formatting in Excel charts.
