One way to create a group index by using DAX is with the function RANKX. How to do that depends on your dataset structure, but this example might give you a good idea or precise solution.
In another DataCornering post, there was an example with group index by using Power Query or R programming language in Power BI Power Query.
If you are not using the R programming language, then here are some guidelines on how to start learning that.
Group index by using DAX
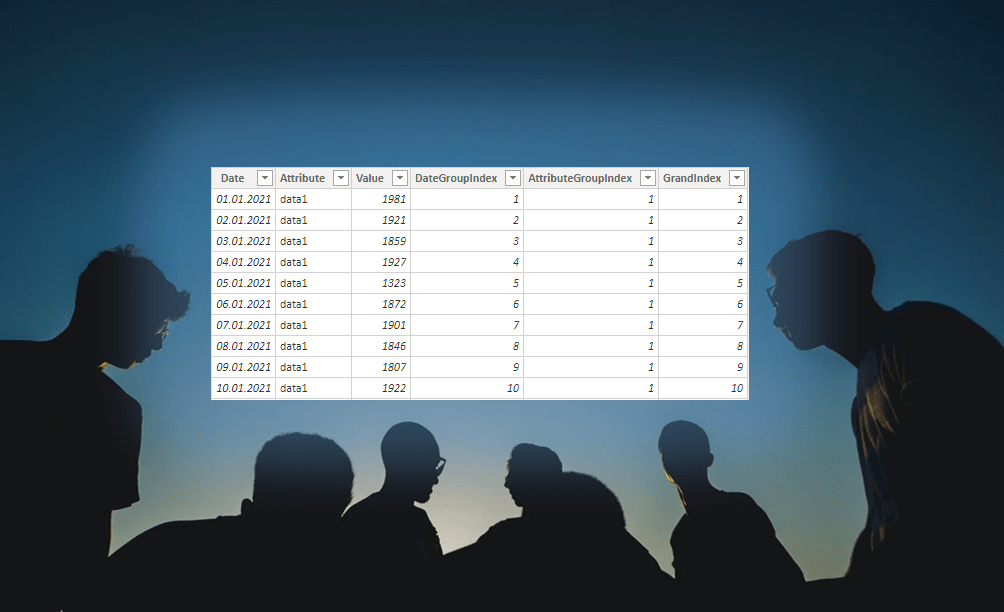
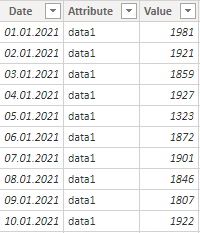
In my dataset, I have 3 columns – Date, Attribute, and Value. You can recreate that by using the Power Query code below.
In the Attribute column are 5 categories, and I will use that to create a group index. For each of the categories in the column Attribute, there are unique date values. The most important here are adjustments of the last two RANKX parameters – Order and Ties.
DateGroupIndex = RANKX(MyTable, MyTable[Date], , ASC, Dense)
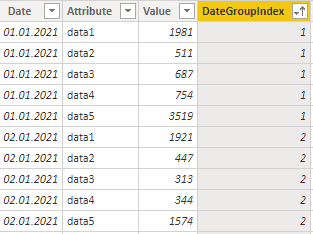
Indexing restarts every time Attribute value changes.
Global table index by using DAX
To calculate an index for each of the table rows, there might be a situation when none of the columns have unique values and determine the sequence. But if multiple columns can do that in combination, it is possible to use them in RANKX.
In my case, there is a date and the column Attribute with 5 possible categories. A combination of both of them will make every row unique, but it is not straightforward. Some of the combinations are repeating. In RANKX there is possible to use an expression for the ranking. That allows using of nested RANKX to get the results for multiple columns.
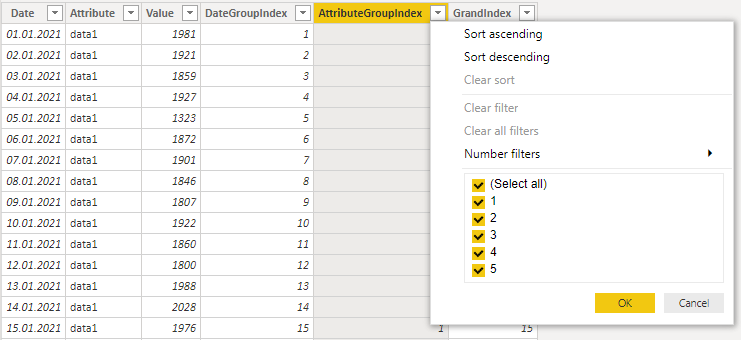
If I create indexing for the group Attribute, I get numbers from one to five.
AttributeGroupIndex = RANKX(MyTable, MyTable[Attribute], , ASC, Dense)
I can use that as a column in further calculations or create nested RANKX like this.
GrandIndex =
RANKX (
    MyTable,
    MyTable[DateGroupIndex]
        + RANKX ( MyTable, MyTable[Attribute],, ASC, DENSE )
            * MAX ( MyTable[DateGroupIndex] ),
    ,
    ASC,
    DENSE
)
Conclusion
If you are using the possible granularity of a group and describe combinations mathematically, you can make all kinds of indices.
Maybe it makes sense to do that in Power Query or by using programming language R. In that case, take a look at this post.
If you have DAX performance issues, then look at this post for a more advanced approach.
Here is Power Query code that you can use in a blank query to recreate my dataset.
let
    Source = Table.FromRows(Json.Document(Binary.Decompress(Binary.FromText("dZtdrt02DIT3kuegEPWvtQR5CNAldP/o8ZA8dswhUOCi+CCfsUSNSFr59etHkX8+/9VS5cfPH//++e/P9VfOlh+/fxJaP3+HJLB9/s69OOyfv2t0DsfnbxtylFYqqQqnl6TeF4eXpCaNw0tS653DS5KMZbQxSXscTiteJ4GXpF4ah5ekWYRDSGqylXY+S4tTzNJoHLbnqr4hJO3kRyGpj6l0MEmtNk4haVcOL0lnJc+9JJ2SPBaS5rbZn3ThVuX0krSOcHhJ+i75G16SpPbJ6aWp7mqTuOjK+aq/6aVJRBKKPVcqh11XZ3EKUX0Z3XSi/IXetGIuGoeXpuUO8oY6Ub6v3hSaxG3iUE1lcXppmk04xOLVyiE0ffYOp0N/VV9WCt92lVPE+BIO4QRzcYht1xOoMe6SqIXvWTiFObVkKCTZBggQfmn+HuDA1hkKqYPvUjiFItuSAWLhZvJcGEEXDjFJxZ9LHfyYrwV6STp1coj4nslzNb5PQqHJHUaYhX/+d3OK+F4JhA+0yiGm6XQO9aCzU0WohbsRB4rwPo1DSJqHQ91yrXOqJ51vKurhx9wnUEzTnhzipFvJc01T4RSaqoc/93Df6czDu2UaATb1YQ41IRgcDpyDBqmBn1o4/csFmIE3OzYChAtkjx0ICFNE7budySnWbW4O9ZhLYIdFHA4xR/YulZq3O2WgqigZikiynDRAjaTZOdVIWjpLlSfgpXOKDMVmKUBo2glUr5wc6oazPKJy+7aUKlDUBJYCBoiFG5vD/nDZANW+bV9Uat/L35XZ97CEKkBIOodDSDL3CBCSpBilCbifC4FCkr8Nc+92Cocdq5r86CXJE7FKzbv4c5l5t3Y41NxEOLwUVdvHAV6Kho9k1n3K4RAuaUlCgMgDPHyZcy87/QJEZmL2UKlvTzsbA8Vuk8EhFK3CoTpANtS2m70Nde41CqfQ1DaH0FQSqGnA4VB90uaBOvfXRZlzr5lAFHK9cQhFI4FQZPl8485tsx8oImlODjWjrBwiks7iEJHUDPKsuw1ONVOqHGr9fTjE9rcADRDb3/smH1jj9vei502hyOIoQM2TJocd71I4RAYgd68mKFpjcai10uSwYcdI5xQZQE+eC0NyuY3N0bcv9aaIbC/b3xCSqrlOoP25xQNFJO27V0M0+bq9KbKSkwyFJpkJRXCv5LkaSjZyMEm7VE61MkmgTpNMTuEAHoVveEmaW3fU1VMhknzR3xSSeuVQZ8mykkDNugun0HTubgzRZK4fqO64yqE69+EQHlA7h4jvar+5iaLdD4fapxQOkSatBKII8Fd5Q3Rz592lCYJmSyCSpF05xKqlFBawOocwJYNXM4Us2m6cotNVD4cqyYuWN+3qvwlFINmOEmrdawxO1ZYSqE7p5RDz7m2RH6Dmt+NuthBNK6HaOt0cqiavnal7W3QHiGkadzuFSWqcYul6MlRt6dH/iZJa8lxIalbGJuYtnGKWRgLRVyrJc3HoWgkWoJbddzMlKvKeaqD6YWBwCEXerWLW3frhEI1ca5YLtW4Zk1M9TZKhat0lGfrM3gJUW7o7NFFS80hizu0leYDaDtwc4nzzVix1bmuUC3Nu6T4PzLo/01A5xSx13+bMvFdvHGKWfKcy85blfWfm3p+KfXKqmixjD1QruORnkZp4eUfte0nnFB5QCocqyYtKat9iLxuoZpV3D4esnbdTmH17Ty9A1EstgZp5J4+FIovgSs1bvBXAzNtTqQChSJLnaivgcIhYMgOu1LtLF06x46yzHCA6pmIfBQJFKEkyVCfpbsMQEzAzDFTD27ZroIil4+0U5t6fUNqcak55t2miqJpRiKp2PgYKUdt7iczAt+25AKGp21RQA58toX9rog6+q3CKxZuFQ2iad6+G7LlzOIWmORLalE5OtbpMICq5fndcSECdhNo8dU41Z3L7YR7efQcwD//2a68KvcWNN4VTi/LNqdW8yVitChaH4+EUH7lR03kU8FGS1GSofj4pCUU8ZUORNvW79o/T1LzQflNoGrYDAoWm1YRT7cQ3DhHj9nnlqtGjJjnCadXj7HAKTXVsTvGdaSRDtVQxOJimb3H6prrvvJh+U9U0J6e675KhWDsr2q4inazdo8Ana7cTCk1td04xT7NwiMPFqoarTCfb7mxOqyoWTq2H0jnFtpuHQ2iSu1KP285bY2+o9vS4HxIlyRmcIi143A8JktrjFgcJ8Smc6jTtZCw+o1S/GPSmaKLMyiGmycuKQjTN2TjUaFqHU0TT7MlY3XXCoaYqd6keV64m8JJUSxmcqiSvvpiHz1k5VHOyV2UeLnV2TtWcyuBUN91cnELTSiCMwKJJqInXxx0QYk67cApNoyZP1g/zm0NNnu6rGsQIaudUz18vsZiJy3zcH4lGMJKfVSO472oQTaVzqruuHU7VnGry5K52yiGcwNqlwkzcj8kANZxOMtT6codTDXHhEEu37lKfnb+VU2hafr+BeXjrjz5BPOtO41D74KaJefgnOUqoalrCqV6PrQmFYZbkwVr/3gV71OSfjwNVTXtyim23vV3FTHxJ4VD7KZbjMxP/5nOB2mGXjFXLlMIp4slbAczF5+PaBYmntTmtfymmqfjwr8TMxr+vw2y8mYlUauOlH06tPCicQtOayZNRBGc/Cxuvd0lPNO3GqdYHPRmrl5nq4hQxvoRDfIGWu2gnMS6LU8sKEgpNZU1O4QUiHKIX5rcZqI3LoxtAPNOLRpqLf2Oc2fgqwiE0eZeB5uLdGyPUx+vj6gaJcRmc6hXZ5MF6N87Wjvr497oT9XHxfUd9vJbJqZ4th0P96nt3A8ja1ckp+mE+TTQX/953Yjb+vedDbdyvojEbPz7BzMXnahyqEfTkuV0PAA41T7FrFNTEyxFONZh6QnGlqZ3K6fNfXgSowXTf3iAHcDucWlN8c4pg8q/5gT4PlgCh6TLM3/8D", BinaryEncoding.Base64), Compression.Deflate)), let _t = ((type nullable text) meta [Serialized.Text = true]) in type table [Date = _t, Attribute = _t, Value = _t]),
    #"Changed Type" = Table.TransformColumnTypes(Source,{{"Date", type date}, {"Attribute", type text}, {"Value", Int64.Type}})
in
    #"Changed Type"
Leave a Reply