Category: R

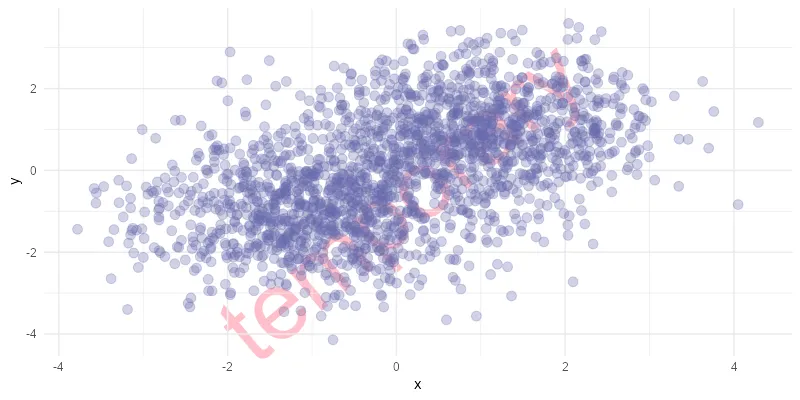
How to change marker shape in the R plot
Sometimes you might wonder how to remove the border around dots in ggplot2, but all you have to do is change the marker shape in the R plot. When creating a plot in R that contains markers, it is possible to adjust the color, transparency, and also shape.
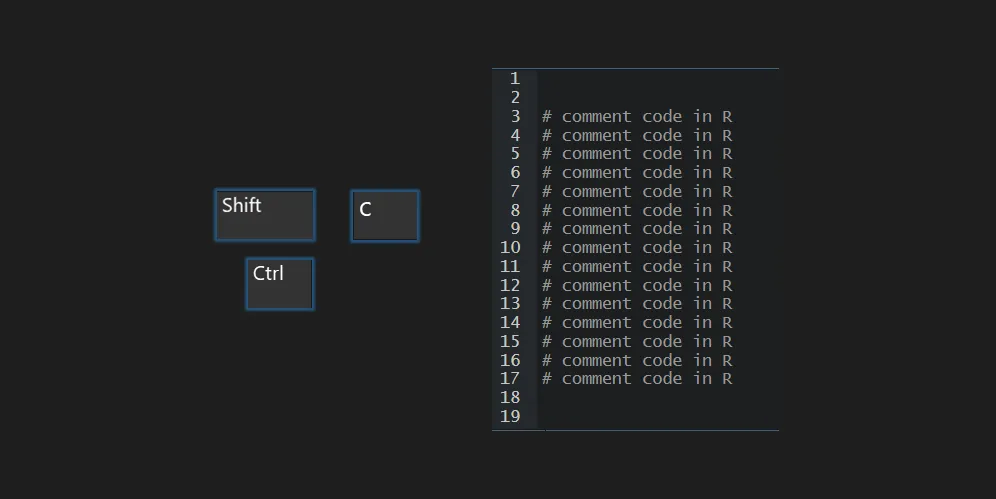
Comment out multiple lines in R or uncomment
Here is how to comment out multiple lines in R by using the shortcut Ctrl + Shift + C or other techniques. In RStudio, you can comment and uncomment a block of code by using a shortcut or GUI. Commenting is very useful if you want to keep a peace code for later or experiment…
How to find or set the working directory in R
Sometimes it is necessary to find or set a working directory in R, even if you don’t necessarily want to. For example, if you are saving an R plot and do not understand where the result goes, it is necessary to look for that. You can do working directory detection or setup using the base…
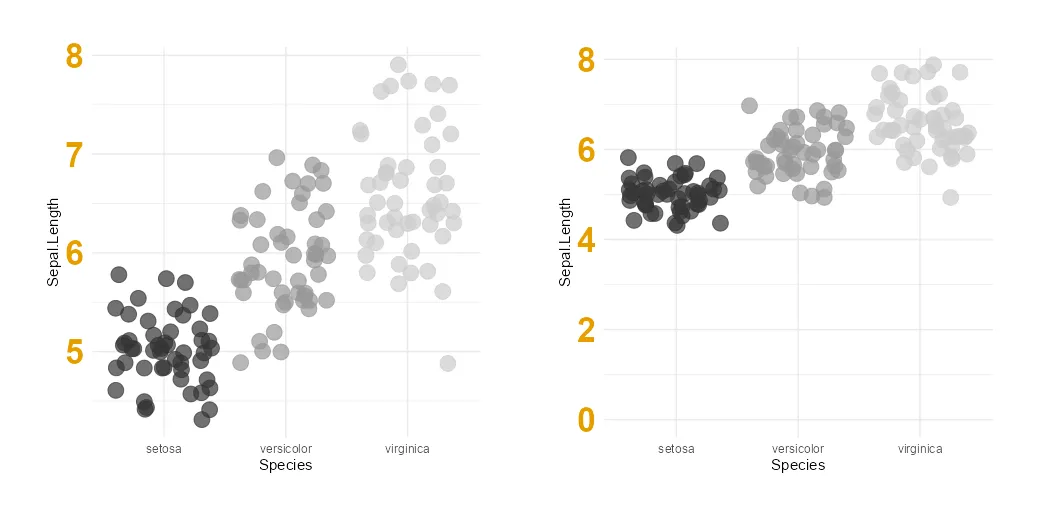
How to adjust R ggplot2 axis to start at 0 or set other limits
Here is how to change the beginning or end of the R plot axis or execute common adjustment – set the ggplot2 axis to start at 0. If it is not happening automatically, then you might want to force the origin of the R plot y-axis. A vertical axis beginning from zero is good practice…
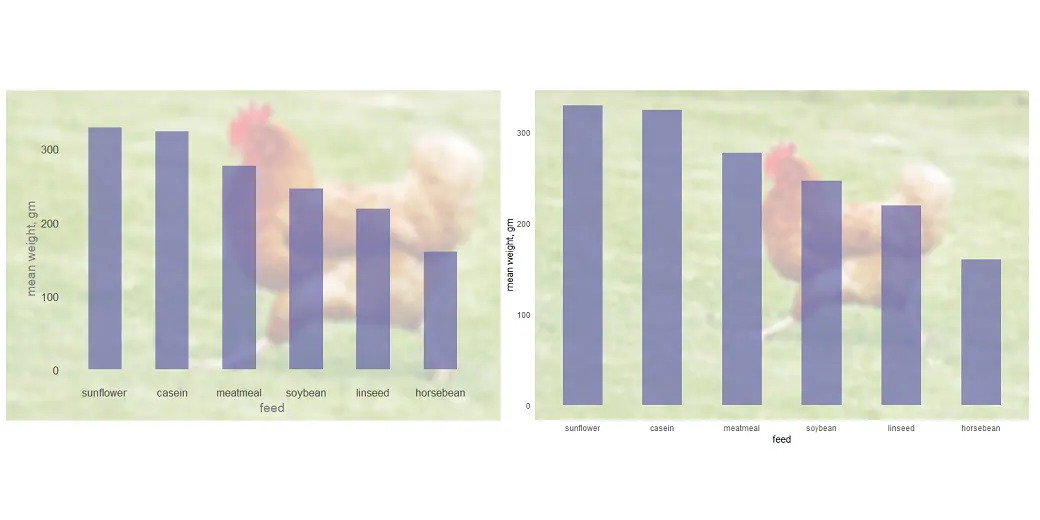
How to use an image in a chart background in R
There are different ways how to use an image as the chart background in R. You can add that only in the panel background or plot background, or you can put the plot on top of the image.
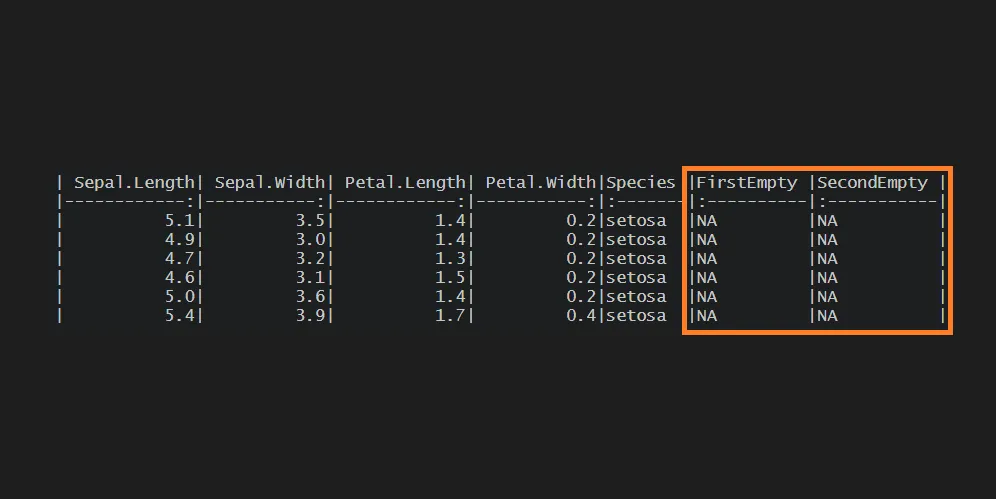
How to create a blank column in the R data frame?
Sometimes it is necessary to create a blank column in the R data frame to ensure that it will be available at all times. Here are multiple scenarios on how to do that. It might be just one blank column or multiple blank columns. Sometimes based on which of the necessary columns are missing.
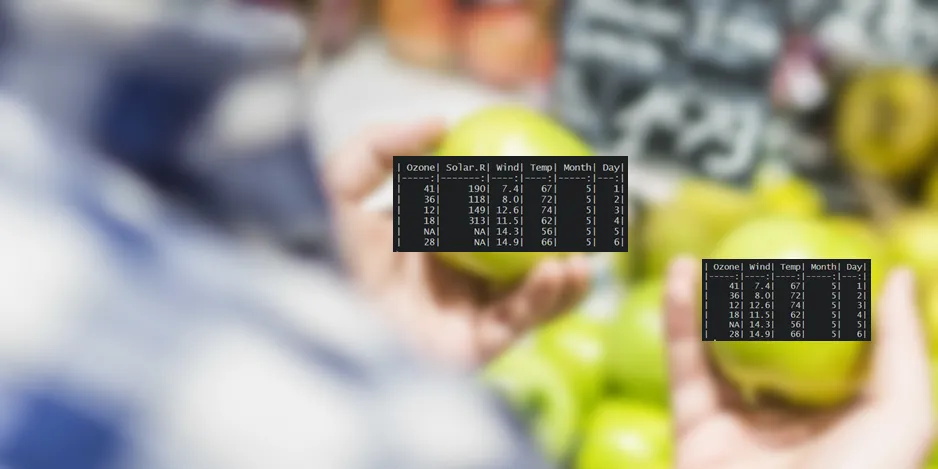
Compare data frames in R, column names, data types, and content
Before appending or joining, it might be necessary to compare data frames in R. For example, differences in column names and data types. Sometimes even necessary if you are dealing with an error caused by unmatching columns or data types. Besides that, you can also compare other content.

Add data labels to column or bar chart in R
Here are multiple examples of how to add data labels to the column or bar chart in R if you are using the ggplot2 or plotly packages. You can add them in various positions, and it is good to know typical ones. In the case of plotly, interactivity and tooltips might be enough, but you…
How to save R plots or other results temporarily
If you want to save R plots or other script results temporarily, here is a simple way to do that. It might be helpful if it is necessary to save them outside the R environment, but you don’t want to clean up secondary results. For example, by converting plots to another image format. Here is…